If you would like to participate please contact us. Donations to the general fund to support those who cannot afford the cost of the test are welcome.
DNA STUDY


By comparing the group’s results with other databases, we have been able to establish not only where broken lines fit into the family tree, but found a number of cousins with similar surnames where the Hawgood name has been misspelt over the years. More information on these misspelt names is found on the page ‘matches to other surnames’.
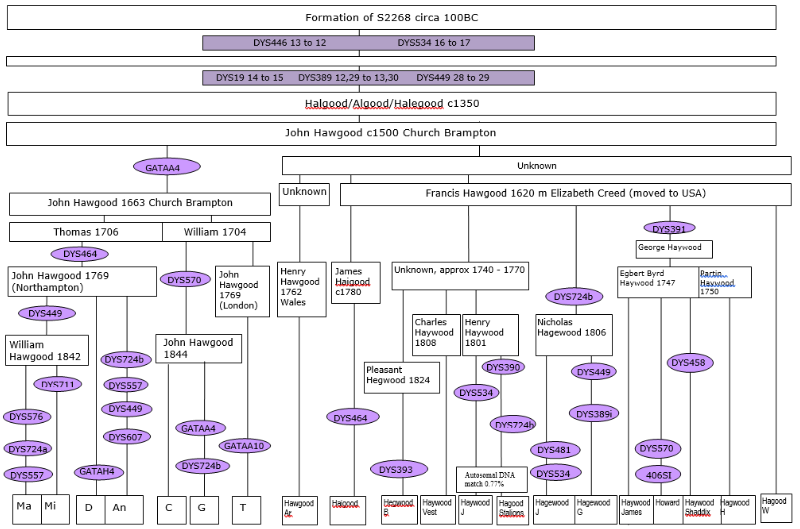
Most results have many matching markers. Where there is a mismatch but where that some mismatch occurs in more than one person, this usually represents a new branch of the family tree. In the diagram below, mutations are shown as pink ovals. It is possibly but very unlikely that the same mutation will occur by chance in unrelated branches, except with the very fast mutating markers such as DYS724a and DYS724b whose mutation rates are up to 10 times faster than the normal mutation speed of most other markers.
The diagram below shows a high level tree from around 100BC, although actual records have only been found since 1500. We are able to establish the earlier history from broader analysis of the marker values. More information can be found at the FTDNA site for group I1-Z138.
Summary results